Now that it’s March, you’re going to see a lot of different Season Previews popping up around the web. Some of these will go team by team, others will go division by division, and a few others will just talk about the expected contenders while giving short shrift to those who might not be ready to win just quite yet. We wanted to do something a little different, however, so starting today, we’re going position by position around the league, and comparing the relative merits of each team’s options at each spot on the field for 2012. This is only looking at the upcoming season and doesn’t account for potential long term value – we’re just concerned with what each team may get from a given spot on the field this year.
We’re going to kick it off this afternoon with catchers and first baseman, and we’ll do a couple posts per day until we get through the starters and relievers on Friday. The goal is that, by the end of the week, we will have provided a look at where each team is strong or weak, and what kind of performance a team can expect to get from their current in-house options.
The fun part of comparing teams at a given position is that we’re not limited to just looking at one player, but can compare the expected production of an everyday guy against a left/right platoon, or we can note what a team should expect from giving a stop-gap two months of playing time before they call up their top prospect in the early summer. Few teams get an entire season’s worth of playing time at a position from one guy, so by using depth charts to create an expected playing time matrix, we can give a more thorough evaluation of what kind of strength an organization has at a given spot.
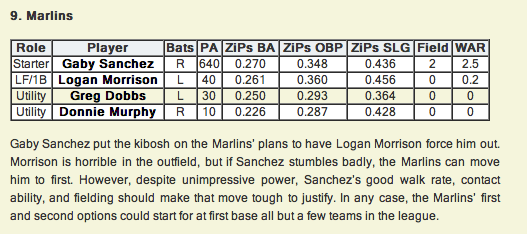
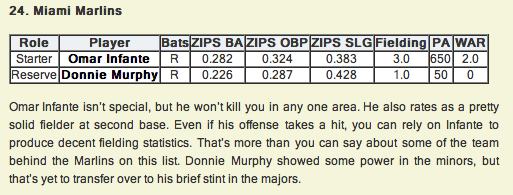
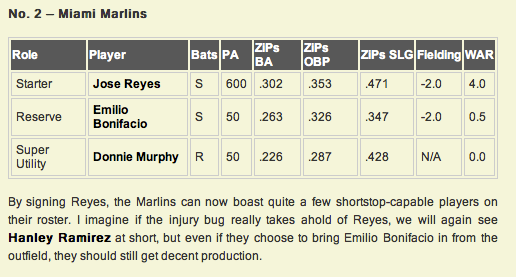
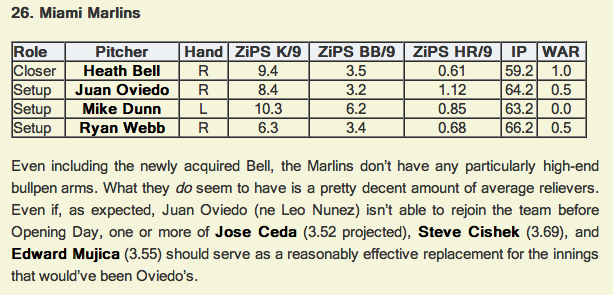
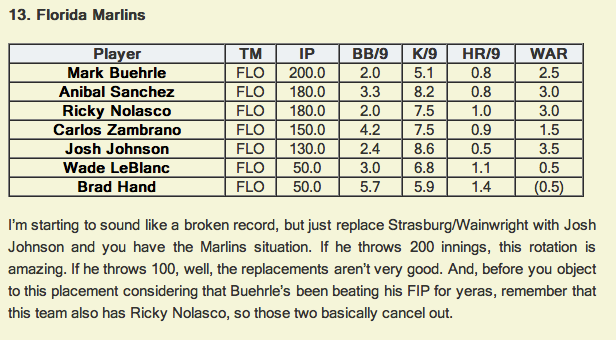
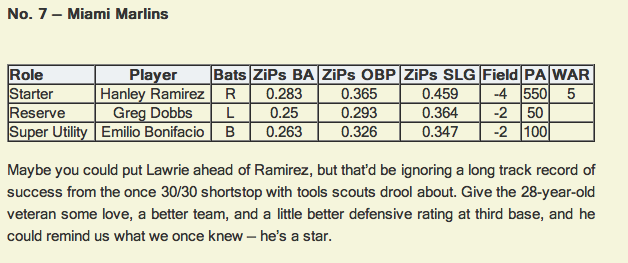
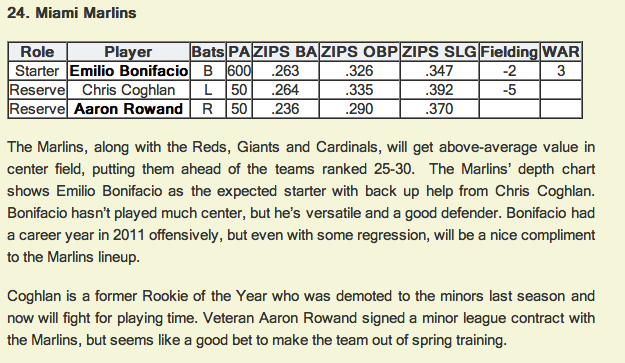
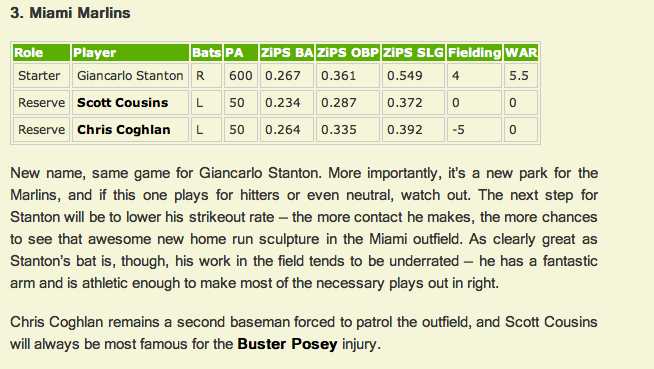
To help provide some realistic expectations, we’re laying out the ZIPS projections for each player on the depth chart, and combining those with the expected fielding rating from the FAN’s projections and our best estimates of the quantity of playing time that a player will get at the given position. From that, we’re eyeballing projected WAR for each player at that spot, but keep in mind that for players who are expected to split their time between multiple positions – Mike Napoli, for example – their WAR numbers are just for the given position being discussed, and not for their overall season total. Napoli may very well be a +5 win player, but that split could be +3 C, +1 1B, and +1 DH, which the tables will attempt to reflect. Also, don’t take small differences in those numbers too literally – if one guy’s projected for +2 WAR at second base and another guy is projected for +2.5, that’s basically a tie. We’re not trying to split small hairs here.
We hope you guys enjoy this format. We think it offers some advantages over a typical season preview, and will hopefully give you some insight into interesting position battles that you might not have been aware of, while also highlighting the potential value of a platoon or other non-traditional way of allocating playing time at one position.
2nd Base
Short Stop
the rest will be posted when FanGraphs posts 'em


Comment